OK employment data: Jobs down, Wages up
The Southwest Information Office of the U.S. Bureau of Labor Statistics today released, County Employment and Wages in Oklahoma–Second Quarter 2016. The report shows national rankings of wage levels, wage growth, and employment changes for the 344 largest counties in the United States, including 3 large counties in Oklahoma. The report also provides employment and wage levels for the 74 smaller Oklahoma counties (those with employment below 75,000). Assistant Commissioner for Regional Operations Stanley W. Suchman noted the following highlights:
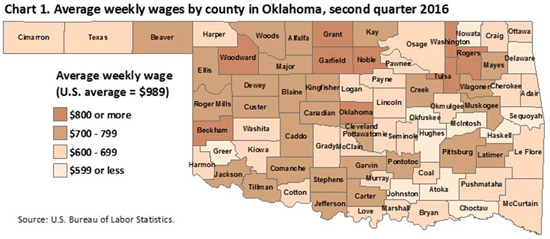
• Employment fell in Oklahoma’s three large counties from June 2015 to June 2016, down at a 1.0-percent pace in the counties of Oklahoma and Tulsa, and down 0.2 percent in Cleveland. • In contrast, all three large Oklahoma counties experienced gains in average weekly wages from the second quarter of 2015 to the second quarter of 2016. Cleveland County had the fastest rate of increase in weekly wages, up 3.2 percent, as wages in Oklahoma and Tulsa Counties rose 2.0 and 0.3 percent, respectively. (Nationally, wages rose 2.2 percent.) • Weekly wage levels in the state’s three large counties were below the nationwide average ($989) in the second quarter of 2016. Average weekly wages in Oklahoma County ($917) and Tulsa County ($892) ranked 164th and 185th, respectively, near the middle of the national ranking, while weekly wages in Cleveland County ($743) ranked among the lowest at 327th. • All 74 smaller counties in Oklahoma – those with employment below 75,000 – reported average weekly wages below the $989 national average. Among these smaller counties, Washington ($895) and Grant ($864) posted the highest weekly wages, while Sequoyah reported the lowest ($531).
This information comes from the Bureau's Quarterly Census of Employment and Wages (QCEW). The QCEW program contains extensive data on both employment and wages by detailed industry for all States and counties.
Historical data on weekly wages for all counties in the U.S. can be accessed by clicking here. However, due to the extremely large size of the QCEW database, that location contains only about 10 percent of all records. A new access portal has been designed by the Bureau which contains more extensive information and also includes ‘quick view’ options for various data by geography, NAICS industries, and size classification. This ‘quick view’ database is located here. Additionally, BLS has an interactive online mapping utility which can display information similar to that shown below and can be accessed here.


